UK insolvency statistics: a phantom wave?
You’ve probably seen recent news coverage trumpeting the rapid rise in insolvencies during 2022. But these headlines don’t tell the full story.
The latest government insolvency statistics (for Q4 2022) present a very similar picture to that reported in our previous articles. Corporate insolvencies continued to rise – they were 9% above the previous quarter and 30% higher than the equivalent quarter in 2021.
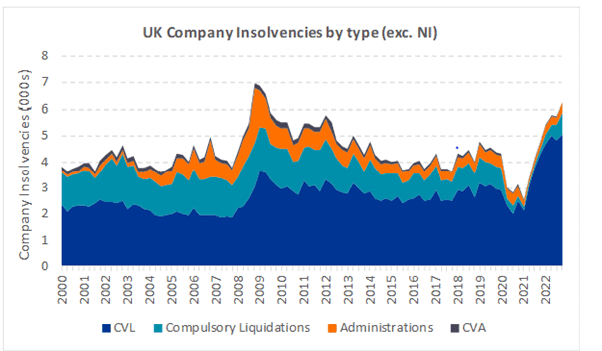
But these failures are concentrated very much among smaller companies. Of the 5,995 company insolvencies in Q4, 82% (4,891) were creditors’ voluntary liquidations (CVLs) – which are generally used for smaller companies.
By contrast administrations, which tend to involve larger companies, accounted for only 6% of corporate insolvencies. Administrations are on the rise. They increased 31% on the previous quarter and were 34% above Q4 2021.
But the annual level of administrations was still around a third lower than 2019, well below pre-pandemic levels. Administrations accounted for 6% of total insolvencies. By comparison, at the height of the credit crunch (Q4 2008) administrations were at 30% of total insolvencies. The chart below shows the changing profile of UK insolvencies since 2000.
Insolvencies and redundancies
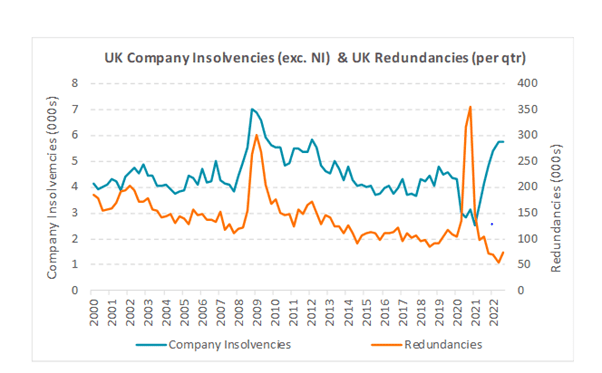
So what is the economic effect of this wave of insolvencies? We would argue that it’s minimal at this point. To some extent, it might even be thought of as a phantom wave. Examine the link between company insolvency levels in the UK and redundancy levels (which are considered perhaps the biggest impact on the wider economy). An interesting, counter-intuitive picture emerges. Whilst insolvencies are the highest they have been for almost 15 years, redundancies (as reported by the ONS) are at record lows.
The chart below shows that the two have been closely correlated for the past 20 years: a spike in insolvencies causes a spike in redundancies.
But that correlation was broken – reversed even – by the pandemic. Whilst insolvencies hit record lows in 2020 (thanks to government-backed loan schemes and an 18-month moratorium on winding up petitions), redundancies hit record highs. The spike in 2020 came in Q4, when furlough funding began to taper. This initial reversal in the relationship makes sense in the unusual environment of the pandemic.
But normal service has not been resumed. Although insolvency numbers have climbed steeply, redundancy levels have plumbed historically low depths. In Q3 of 2022 (the most recent statistics), 75,000 redundancies were reported, compared to 173,000 (130% higher) the last time insolvencies were this high (in Q1 2012). Similarly, the current unemployment rate (from the ONS) is only 3.7% compared to 7.8% in Q1 2012.
CVLs are key
We think this can be explained by the large number of CVLs in the insolvency numbers. The vast bulk of these will relate to companies with employees in low single figures. So 100 CVLs might result in a few hundred redundancies – whilst just a single administration could have the same effect.
So the high rate of insolvencies is not contributing to a corresponding wave of redundancies. And the overall economic impact, certainly as far as employment rates is concerned, is negligible. The biggest macro-economic impact of the current wave of failures is likely to be on the State’s balance sheet. There is limited up-to-date information on BBLS and CBILS loan write-off rates. But we anticipate that most of these failures will trigger claims from banks and other lenders under the Government’s loan guarantee schemes, and will also involve write-offs for HMRC in relation to PAYE and VAT arrears accrued during and after Covid.
None of this is to say that there could not be more pain to come for the economy. If we start to see significant rises in failures of larger companies, this will very likely feed through to a significant increase in redundancies and other harmful economic effects.
But, at the moment, that is not what the insolvency statistics are telling us, whatever the headline writers might want you to think.
If you would like more information about any of the issues raised in this article, please contact Oliver Collinge.

